Interactive use of PyEPR
In this tutorial it is showed an example of how to use PyEPR interactively to open, browse and display data of an ENVISAT ASAR product.
For the interactive session it is used the IPython interactive shell an started with the ipython -pylab option to enable interactive plotting provided by the matplotlib package.
The ASAR product used in this example is a free sample available at the ESA web site.
epr module and classes
After starting the ipython shell with the following command:
$ ipython -pylab
one can import the epr module and start start taking confidence with available classes and functions:
Python 2.6.6 (r266:84292, Sep 15 2010, 16:22:56)
Type "copyright", "credits" or "license" for more information.

IPython 0.10 -- An enhanced Interactive Python.
?         -> Introduction and overview of IPython's features.
%quickref -> Quick reference.
help      -> Python's own help system.
object?   -> Details about 'object'. ?object also works, ?? prints more.

  Welcome to pylab, a matplotlib-based Python environment.
  For more information, type 'help(pylab)'.

In [1]: import epr

In [2]: epr?

Base Class:       <type 'module'>
String Form:   <module 'epr' from 'epr.so'>
Namespace:        Interactive
File:             /home/antonio/projects/pyepr/epr.so
Docstring:
    Python bindings for ENVISAT Product Reader C API

    PyEPR_ provides Python_ bindings for the ENVISAT Product Reader C API
    (`EPR API`_) for reading satellite data from ENVISAT_ ESA_ (European
    Space Agency) mission.

    PyEPR_ is fully object oriented and, as well as the `EPR API`_ for C,
    supports ENVISAT_ MERIS, AATSR Level 1B and Level 2 and also ASAR data
    products. It provides access to the data either on a geophysical
    (decoded, ready-to-use pixel samples) or on a raw data layer.
    The raw data access makes it possible to read any data field contained
    in a product file.

    .. _PyEPR: http://avalentino.github.com/pyepr
    .. _Python: http://www.python.org
    .. _`EPR API`: https://github.com/bcdev/epr-api
    .. _ENVISAT: http://envisat.esa.int
    .. _ESA: http://earth.esa.int

In [3]: epr.__version__, epr.EPR_C_API_VERSION
Out[3]: ('0.7.1', '2.3dev')
Docstrings are available for almost all classes, methods and functions in the epr and they can be displayed using the help() python command or the ? IPython shortcut as showed above.
Also IPython provides a handy tab completion mechanism to automatically complete commands or to display available functions and classes:
In [4]: product = epr. [TAB]
epr.Band                     epr.E_TID_TIME
epr.__builtins__             epr.E_TID_UCHAR
epr.__class__                epr.E_TID_UINT
epr._CLib                    epr.E_TID_UNKNOWN
epr._close_api               epr.E_TID_USHORT
epr.collections              epr.Field
epr.create_bitmask_raster    epr.__file__
epr.create_raster            epr.__format__
epr.Dataset                  epr.__getattribute__
epr.data_type_id_to_str      epr.get_data_type_size
epr.__delattr__              epr.get_sample_model_name
epr.__dict__                 epr.get_scaling_method_name
epr.__doc__                  epr.__hash__
epr.DSD                      epr.__init__
epr.EPR_C_API_VERSION        epr.__name__
epr.EPRError                 epr.__new__
epr.EprObject                epr.np
epr.EPRTime                  epr.open
epr.EPRValueError            epr.__package__
epr.E_SMID_LIN               epr.Product
epr.E_SMID_LOG               epr.Raster
epr.E_SMID_NON               epr.Record
epr.E_SMOD_1OF1              epr.__reduce__
epr.E_SMOD_1OF2              epr.__reduce_ex__
epr.E_SMOD_2OF2              epr.__repr__
epr.E_SMOD_2TOF              epr.__revision__
epr.E_SMOD_3TOI              epr.__setattr__
epr.E_TID_CHAR               epr.__sizeof__
epr.E_TID_DOUBLE             epr.so
epr.E_TID_FLOAT              epr.__str__
epr.E_TID_INT                epr.__subclasshook__
epr.E_TID_SHORT              epr.sys
epr.E_TID_SPARE              epr.__test__
epr.E_TID_STRING             epr.__version__
Iterating over epr objects
epr.Record objects are also iterable so one can write code like the following:
In [18]: for field in record:
             if field.get_num_elems() == 4:
                 print('%s: %d elements' % (field.get_name(), len(field)))

        ....:
nominal_chirp.1.nom_chirp_amp: 4 elements
nominal_chirp.1.nom_chirp_phs: 4 elements
nominal_chirp.2.nom_chirp_amp: 4 elements
nominal_chirp.2.nom_chirp_phs: 4 elements
nominal_chirp.3.nom_chirp_amp: 4 elements
nominal_chirp.3.nom_chirp_phs: 4 elements
nominal_chirp.4.nom_chirp_amp: 4 elements
nominal_chirp.4.nom_chirp_phs: 4 elements
nominal_chirp.5.nom_chirp_amp: 4 elements
nominal_chirp.5.nom_chirp_phs: 4 elements
beam_merge_sl_range: 4 elements
beam_merge_alg_param: 4 elements
Image data
Dealing with image data is simple as well:
In [19]: product.get_band_names()
Out[19]: ['slant_range_time',
          'incident_angle',
          'latitude',
          'longitude',
          'proc_data']

In [19]: band = product.get_band('proc_data')

In [20]: data = band. [TAB]
band.bm_expr                   band.read_as_array
band.__class__                 band.read_raster
band.create_compatible_raster  band.__reduce__
band.data_type                 band.__reduce_ex__
band.__delattr__               band.__repr__
band.description               band.sample_model
band.__doc__                   band.scaling_factor
band.__format__                band.scaling_method
band.__getattribute__          band.scaling_offset
band.get_name                  band.__setattr__
band.__hash__                  band.__sizeof__
band.__init__                  band.spectr_band_index
band.lines_mirrored            band.__str__
band.__new__                   band.__subclasshook__
band.product                   band.unit
band.__pyx_vtable__

In [20]: data = band.read_as_array(1000, 1000, xoffset=100, yoffset=6500, \
xstep=2, ystep=2)

In [21]: data
Out[21]:
array([[ 146.,  153.,  134., ...,   51.,   55.,   72.],
       [ 198.,  163.,  146., ...,   26.,   54.,   57.],
       [ 127.,  205.,  105., ...,   64.,   76.,   61.],
       ...,
       [  64.,   78.,   52., ...,   96.,  176.,  159.],
       [  66.,   41.,   45., ...,  200.,  153.,  203.],
       [  64.,   71.,   88., ...,  289.,  182.,  123.]], dtype=float32)

In [22]: data.shape
Out[22]: (500, 500)

In [23]: imshow(data, cmap=cm.gray, vmin=0, vmax=1000)
Out[23]: <matplotlib.image.AxesImage object at 0x60dcf10>

In [24]: title(band.description)
Out[24]: <matplotlib.text.Text object at 0x67e9950>

In [25]: colorbar()
Out[25]: <matplotlib.colorbar.Colorbar instance at 0x6b18cb0>
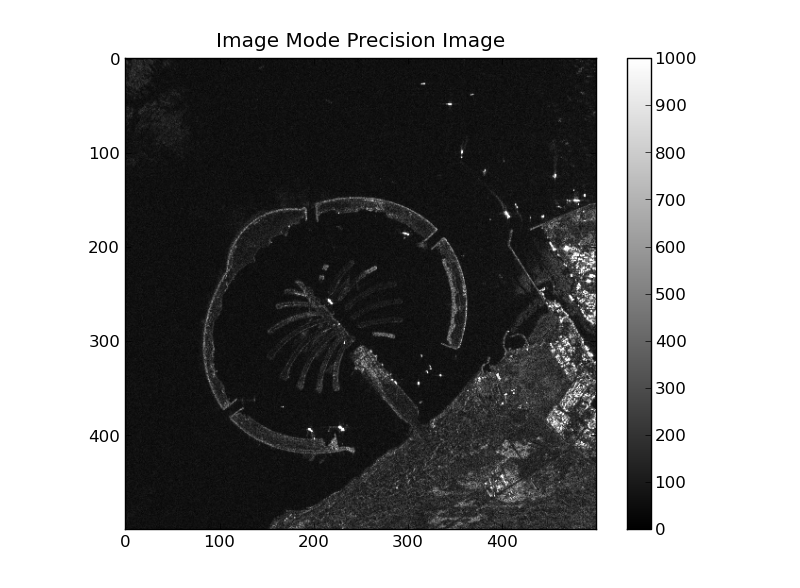
Image data read from the “proc_data” band